How NFL Offenses Beat Coverages
Defenses played zone on 68 percent of dropbacks last season. That single number shapes everything an offense does, because the route that shreds a Cover 3 zone is often the same route that dies against Cover 1 man.
We pulled every charted pass attempt from the 2025 regular season, 17,903 of them across 272 games, and sorted each one by the route the targeted receiver ran and the coverage the defense played. Screens and swings are included but flagged, since those are extended handoffs rather than coverage beaters.
What comes out is not a list of good routes and bad routes. It’s a map of matchups.
The one rule that explains most of it
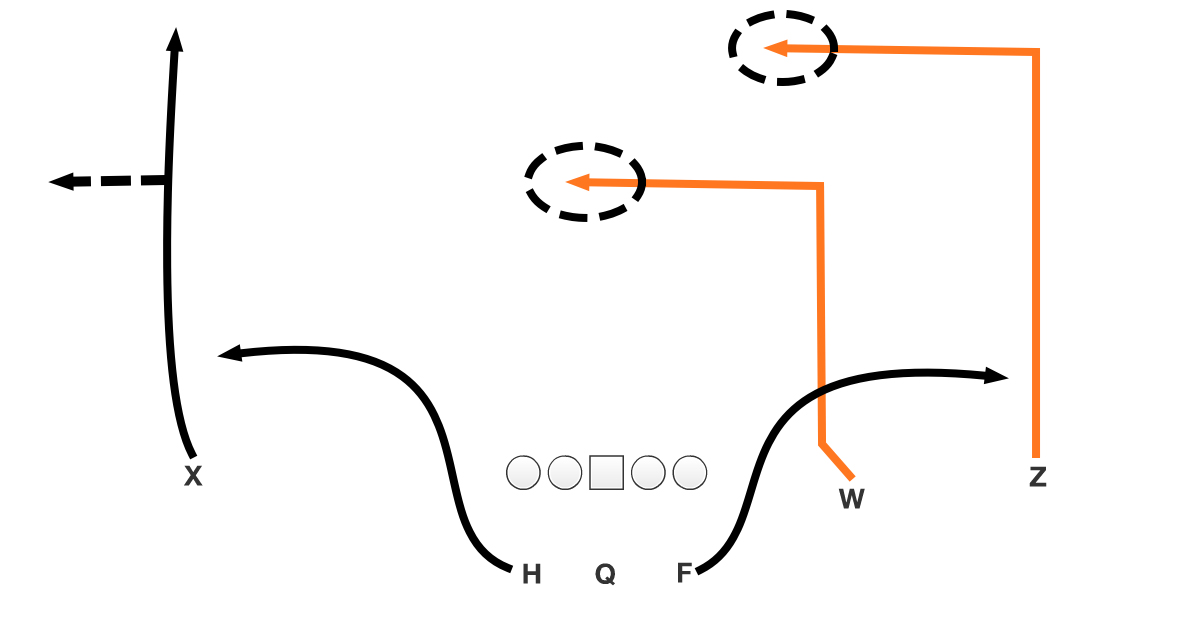
Routes that break beat man coverage. Routes that run vertical beat zone.
The logic holds up when you watch it. A man defender is trailing a receiver’s hips, so a hard break at twelve yards puts him a full step behind with no help underneath. A zone defender is reading the quarterback with his eyes downfield, so that same break lands him right in the passing window he’s already looking at. Reverse it for vertical routes. Man defenders get safety help over the top. Zone defenders have seams, and a go route lives in them.
That’s why the go route gains 10.03 yards per attempt against zone and 7.12 against man. Same route, same receivers, three yards of difference decided entirely by what the defense called.
The catch rate trap
Here’s the part that should change how you read a box score.
The four highest completion rates in the entire dataset all belong to routes that produce nothing.
A screen against Cover 2 gets completed four times out of five and costs the offense expected points. A go route against Cover 4 gets completed once every three-and-a-half tries and is one of the most valuable throws in football.
Catch rate measures whether the ball arrived. It says nothing about whether the play was worth running.
If you evaluate receivers on reception totals, you are systematically rewarding the guys running the cheapest routes on the field.
The post is the answer to everything
One route grades out in the top three against all five major coverages.
Peak value comes against Cover 2, which makes sense structurally. Against Cover 3 the value dips because a single high safety is sitting exactly where the route is going, and that dip comes with a cost we’ll get to in a second.
Roughly half of all posts get completed regardless of coverage. The route isn’t easy against anything. It’s just always worth the attempt.
The corner route needs the right picture
The post works everywhere. The corner route is the opposite, and the swing between its best and worst matchup is the widest of any route we measured.
Against Cover 3, the corner breaks away from a single deep safety and toward a sideline the cornerback has already vacated. Half of them get caught, at 12.72 yards per attempt.
Against Cover 2, the corner route runs directly into the deep half defender’s zone. That’s the throw the coverage is built to take away, and it shows: barely a third get completed, at 6.4 percent interception rate, the highest of any route against Cover 2.
Same route. Same receivers. The difference is whether there’s one safety or two.
Cover 3 gives up chunks and takes them back
Cover 3 was the most common call in football at 4,924 snaps. It also produced the most volatile results.
Deep routes against Cover 3 all clear ten yards per attempt. They also get intercepted at more than double the league rate of 2.1 percent.
The dig is the one to watch, because it’s thrown 406 times, more than any other route in this group. It nets 10.32 yards per attempt, which looks great until you count 25 interceptions. Three underneath zone defenders are reading the quarterback’s eyes in exactly the window the dig occupies, and the throw has to travel across all of them.
Zone coverage doesn’t just take the ball away more often. It does more with it. Of the 29 defensive touchdowns off interceptions last season, 20 came against zone coverage between the twenties, where a defender who breaks on a route has open grass in front of him.
Cover 3 doesn’t stop explosive plays. It bets that it will take the ball away often enough to make them not matter.
Underneath, the picture is the reverse. The slant against Cover 3 posts a 63.9 percent success rate, the highest mark of any route-coverage pairing in the dataset. It gains 8.05 yards per attempt and gets picked off 2.7 percent of the time. Less spectacular, far more repeatable.
Man coverage and the red zone
Man coverage gives up more touchdowns. That’s true, and it’s also mostly a mirage.
Between the twenties, the gap is six tenths of a percentage point. Inside the 20 it explodes to more than eight points, and defenses call man on 47.3 percent of red zone dropbacks against only 29.0 percent everywhere else.
So man coverage looks worse than it is, because it’s on the field for a hugely disproportionate share of scoring chances. But a real effect survives once you account for that. A shrinking field takes away the zone defender’s cushion and turns every route into a footrace, and man coverage still surrenders touchdowns eight points more often once you’re inside the 20.
What to do with this
Route matchup cheat sheet
- vs Man Digs, slants, out routes. Anything with a hard break.
- vs Zone Go routes, corners, anything vertical into a seam.
- vs Cover 1 Post (+0.67), corner (+0.43), go (+0.40).
- vs Cover 2 Post (+0.82). Avoid the corner (+0.14).
- vs Cover 3 Corner (+0.71) and go (+0.53), with interception risk attached.
- vs Cover 4 Post (+0.72) and go (+0.63). Vertical or nothing.
- Never a plan Screens and swings. Highest catch rate, lowest value.
Call breaking routes against man, vertical routes against zone. Digs, slants, and out routes punish trailing defenders. Go routes and corners punish seams.
Stop reading catch rate as a quality signal. The most-caught routes in football are among the least valuable. A receiver at 80 percent on swings and screens is not outperforming one at 45 percent on posts and corners.
Post routes are the closest thing to a free square. No coverage handles them well. Cover 2 handles them worst.
Check the safety count before calling a corner route. One high safety makes it one of the best throws available. Two makes it one of the worst.
Treat Cover 3 as a coin flip on deep shots. The chunks are there. So is triple the normal interception rate.
class="tool-link" href=/tools/plays target= rel= >Methodology
Data covers all 272 regular season games of the 2025 NFL season, 17,903 charted pass attempts with both a route label and a coverage label. Sacks are excluded. Defensive touchdowns are excluded from all touchdown counts. Completions are identified by the presence of yards after catch, which matches the charted completion set exactly. Overall completion rate reads 62.6 percent rather than the true league mark because throwaways carry a route label and count as incompletions.
Coverage buckets Cover 9, combination coverages, and blown coverages were excluded as too small to analyze, totaling under 3 percent of snaps. Any route-coverage pairing with fewer than 30 attempts is excluded entirely. Pairings between 30 and 99 attempts appear in tables but are not used as headline claims. EPA is expected points added per attempt. Success rate is the share of plays gaining enough yardage to be considered on schedule for the down and distance.
